Appearance
Dashboard Overview
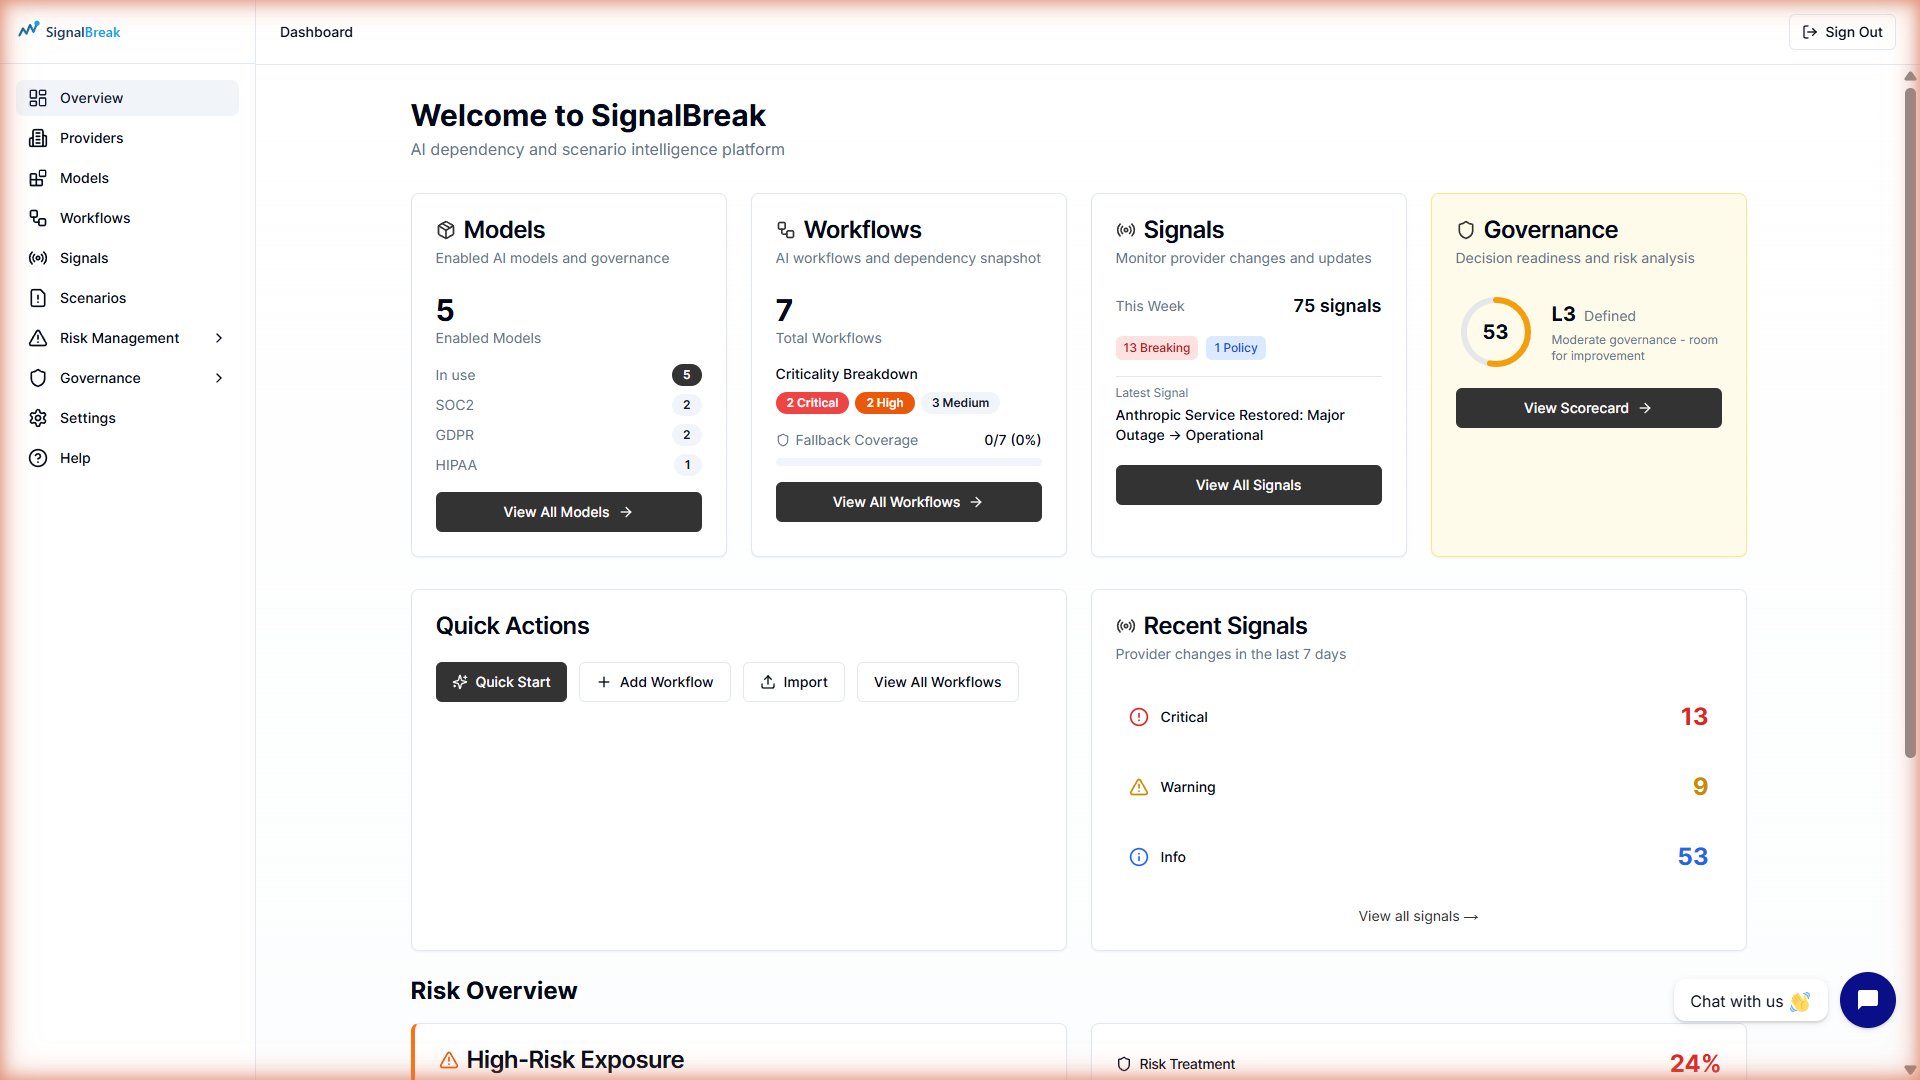
The SignalBreak dashboard provides at-a-glance visibility into your AI provider dependencies, risk exposure, and governance maturity. It's designed to answer three critical questions every time you log in:
- What requires immediate attention? (Critical signals, high-risk exposures)
- How healthy is my AI infrastructure? (Provider status, signal trends)
- How mature is my governance posture? (Governance score, risk treatment)
Navigation
SignalBreak features a collapsible sidebar navigation for efficient screen space usage:
- Expanded Mode (default): Full sidebar with icon + text labels
- Collapsed Mode: Compact sidebar with icons only (hover for labels)
- Toggle Button: Click the menu icon in sidebar header to collapse/expand
The collapsible navigation persists across all pages, allowing you to maximize content viewing area while maintaining quick access to all features.
Dashboard Layout
The dashboard is organized into four main sections:
┌─────────────────────────────────────────────────────────────┐
│  HEADER                                                     │
│  Welcome to SignalBreak                                     │
└─────────────────────────────────────────────────────────────┘
┌─────────────────────────────────────────────────────────────┐
│  STAT WIDGETS (4 cards)                                     │
│  Models | Workflows | Signals | Governance                  │
└─────────────────────────────────────────────────────────────┘
┌─────────────────────────────────────────────────────────────┐
│  QUICK ACTIONS & RECENT SIGNALS (2 cards)                   │
│  Quick Actions | Recent Signals Widget                      │
└─────────────────────────────────────────────────────────────┘
┌─────────────────────────────────────────────────────────────┐
│  RISK OVERVIEW (2 cards)                                    │
│  High-Risk Exposure | Risk Treatment Status                 │
└─────────────────────────────────────────────────────────────┘
Stat Widgets
The top row displays four key metrics that summarize your AI landscape.
1. Models Widget
Shows: Total AI models detected across all providers and connections.
Data Sources:
- Tenant-configured products (e.g., "GPT-4o" from OpenAI)
- Self-hosted discovered models (e.g., "llama3.2:3b" from Ollama)
What It Means:
- High model count (>20) — Comprehensive AI model inventory
- Low model count (<5) — Limited coverage, consider adding more providers or discovery
Example Display:
Models
━━━━━━━━━━━━
   42 models
Click Through: Goes to /providers/directory/products (model catalog view)
2. Workflows Widget
Shows: Total active workflows in your organization.
Data Breakdown:
- Total workflow count
- Breakdown by criticality (Mission-Critical, Important, Nice-to-Have)
- Workflow count by AI capability type
What It Means:
- High workflow count (>20) — Significant AI dependency footprint
- Low workflow count (<5) — Early adoption or incomplete mapping
- High mission-critical % — High business risk if providers fail
Example Display:
Workflows
━━━━━━━━━━━━
   15 workflows

   5 Mission-Critical
   7 Important
   3 Nice-to-Have
Click Through: Goes to /dashboard/workflows (workflow list)
3. Signals Widget
Shows: Provider signal activity over the last 7 days.
Data Displayed:
- Total signals this week
- Breaking changes (critical severity)
- Deprecations (model/API end-of-life)
- Policy changes (terms of service updates)
- Latest signal (most recent event detected)
Background Color:
- Default — Normal signal volume
- Amber/Orange — High signal volume (>10 signals/week)
- Red — Critical signals detected
What It Means:
- 0 signals — Quiet week, no provider changes
- 1-5 signals — Normal activity level
- 5-10 signals — Busy week, review signals
- >10 signals — High activity, prioritize response
Example Display:
Signals
━━━━━━━━━━━━
This Week: 7 signals

[Breaking: 2] [Deprecation: 3] [Policy: 1]

Latest:
"OpenAI Deprecating GPT-3.5 Turbo"
2 hours ago
Click Through: Goes to /dashboard/signals (signal feed)
4. Governance Widget
Shows: Overall governance maturity score and decision readiness level.
Metrics:
- Overall Score (0-100) — Governance maturity percentage
- Maturity Level (L1-L5) — Capability maturity model level
- L1 - Ad-hoc: No formal processes
- L2 - Basic: Initial governance established
- L3 - Defined: Documented processes
- L4 - Managed: Proactive monitoring
- L5 - Optimised: Continuous improvement
- RAG Status (Green/Amber/Red) — Risk classification
- Green: Score ≥70 (strong governance)
- Amber: Score 40-69 (moderate governance)
- Red: Score <40 (early stage)
Circular Score Ring:
- Visual progress indicator showing governance maturity
- Color-coded by RAG status
Background Color:
- Green tint — Strong governance posture
- Amber tint — Room for improvement
- Red tint — Focus on fundamentals needed
What It Means:
| Score | Level | Interpretation | Action Required |
|---|---|---|---|
| 70-100 | L4-L5 | Strong governance, audit-ready | Maintain and optimize |
| 40-69 | L3 | Moderate governance, some gaps | Address identified weaknesses |
| 0-39 | L1-L2 | Early stage | Build foundational controls |
Example Display:
Governance
━━━━━━━━━━━━
   (68)  ← Circular progress ring

   L3 - Defined

   Moderate governance -
   room for improvement

   [View Full Scorecard →]
Click Through: Goes to /dashboard/governance (governance scorecard)
Quick Actions Card
Purpose: One-click access to common workflows.
Available Actions:
| Button | Icon | Destination | Purpose |
|---|---|---|---|
| Quick Start | ✨ Sparkles | /dashboard/quick-start | First-time user wizard |
| Add Workflow | ➕ Plus | /onboarding | Create new workflow |
| Import | 📤 Upload | /dashboard/import | Bulk CSV import |
| View All Workflows | — | /dashboard/workflows | Workflow list |
When to Use:
- Quick Start: First-time setup (one-time wizard)
- Add Workflow: Creating workflows one-by-one
- Import: Bulk onboarding (10+ workflows from CSV)
- View All Workflows: Browse existing workflows
Recent Signals Widget
Shows: Latest 5 provider signals affecting your AI dependencies.
Data Displayed:
- Signal title — AI-generated summary
- Provider — Source provider (OpenAI, Anthropic, etc.)
- Change type — Deprecation, Policy, Pricing, Capability, Incident
- Severity badge — Critical (red), Warning (amber), Info (blue)
- Time ago — Relative timestamp (e.g., "2 hours ago")
Sorting: Most recent signals first
Empty State:
- "No signals this week"
- Displays if no signals detected in last 7 days
Example Display:
Recent Signals
━━━━━━━━━━━━

[🔴 Critical] OpenAI
"OpenAI API Experiencing Elevated Error Rates"
Incident • 15 minutes ago

[🟡 Warning] Anthropic
"Claude 3.5 Sonnet Pricing Update"
Pricing • 2 hours ago

[🔵 Info] Google
"Gemini 1.5 Pro Now Supports 2M Context"
Capability • 1 day ago

[View All Signals →]
Click Behavior:
- Signal row: Opens signal detail page (
/dashboard/signals/[id]) - "View All Signals" button: Goes to signal feed (
/dashboard/signals)
Risk Overview Section
The bottom section provides detailed risk analysis across your AI systems.
High-Risk Exposure Widget
Purpose: Identify AI systems with highest risk exposure from active signals.
Data Displayed:
- System name — AI system (e.g., "Customer Support AI")
- Risk classification — Critical, High, Medium, Low
- Signal count — Number of active signals affecting this system
Calculation:
High-Risk Exposure = AI Systems with:
  - Risk Classification: Critical or High
  - Active Signals: >2 signals in last 30 days

Sorted by: Signal count (descending)
UI Indicators:
| Risk Level | Border Color | Badge Color |
|---|---|---|
| Critical | Red (left border) | Red badge |
| High | Orange (left border) | Orange badge |
| Medium | Gray | Gray badge |
| Low | Gray | Gray badge |
What It Means:
| Signal Count | Risk Level | Action Required |
|---|---|---|
| 5+ signals | Critical | Immediate investigation |
| 3-4 signals | High | Review within 24 hours |
| 1-2 signals | Moderate | Monitor trends |
| 0 signals | Low | No action needed |
Example Display:
High-Risk Exposure
━━━━━━━━━━━━━━━━━
│ Customer Support AI
│ [Critical] • 5 active signals
│
│ Legal Document Analysis
│ [High] • 3 active signals
│
│ Image Captioning Pipeline
│ [High] • 3 active signals
│
Showing top 3 high-risk systems by signal count
Click Through: Clicking any system row navigates to workflow detail page (/dashboard/workflows/[id])
Empty State:
- "No risk data available"
- "Add workflows to see risk exposure"
- Displayed when no workflows are configured
Risk Treatment Card
Purpose: Track mitigation progress for identified risks.
Data Displayed:
- Total risks — All MIT domain risks identified across workflows
- Treated risks — Risks with active mitigation (Accept, Mitigate, Transfer, Avoid)
- Untreated risks — Risks with no treatment decision
- Treatment percentage — (Treated / Total) × 100
Risk Treatment Status:
| Status | Definition | Action Taken |
|---|---|---|
| Treated | Risk has assigned treatment | Accept, Mitigate, Transfer, or Avoid |
| Untreated | No treatment decision | No action taken yet |
Visual Indicator:
- Progress bar showing treatment percentage
- Color-coded:
- Green: >80% treated (good coverage)
- Amber: 50-80% treated (moderate coverage)
- Red: <50% treated (gaps in risk management)
What It Means:
| Treatment % | Governance Maturity | Action Required |
|---|---|---|
| 80-100% | High | Maintain current practice |
| 50-79% | Moderate | Accelerate risk treatment |
| 0-49% | Low | Prioritize untreated risks |
Example Display:
Risk Treatment
━━━━━━━━━━━━━━
Total Risks: 12

Treated:   8 (67%)
Untreated: 4 (33%)

[███████░░░] 67%

Recommendation:
Review 4 untreated risks and assign treatment strategies

[View Risk Register →]
Click Through: Goes to /dashboard/workflows (risk register view)
Empty State:
- "No risks identified"
- Displayed when no workflows have MIT domain risk mappings
Dashboard Refresh
Auto-Refresh
Behavior: Dashboard widgets auto-refresh on page load only.
Manual Refresh: Browser refresh (F5 / Cmd+R) to update all widgets.
Real-Time Updates: Not implemented (planned for future release).
Data Freshness
| Widget | Data Freshness | Update Trigger |
|---|---|---|
| Models | Real-time | On page load |
| Workflows | Real-time | On page load |
| Signals | Last 7 days | On page load |
| Governance | Calculated on-demand | On page load |
| Recent Signals | Last 5 signals | On page load |
| High-Risk Exposure | Last 30 days | On page load |
| Risk Treatment | Real-time | On page load |
Customization Options
Current Customization (v1.0)
Not Customizable:
- Widget layout (fixed 4-2-2 grid)
- Widget visibility (all widgets always visible)
- Time ranges (signals: 7 days, risk: 30 days)
- Sort order (fixed: most recent, highest risk)
Why: Dashboard is optimized for decision readiness—most critical information front and center.
Planned Customization (Future)
Roadmap (Q2-Q3 2026):
- Drag-and-drop widget reordering
- Hide/show individual widgets
- Custom time ranges for signal/risk widgets
- Favorite workflows pinned to dashboard
- Custom alert thresholds
Interpreting Your Dashboard
Scenario 1: All Green, No Action Needed
Dashboard State:
- ✅ Governance: Green (score 75), L4 Maturity
- ✅ Signals: 2 signals this week (both Info severity)
- ✅ High-Risk Exposure: Empty (no high-risk systems)
- ✅ Risk Treatment: 90% treated
Interpretation: Strong governance posture, minimal provider activity, proactive risk management.
Action: Continue monitoring. Generate monthly evidence pack for audit trail.
Scenario 2: Amber Governance, Moderate Activity
Dashboard State:
- ⚠️ Governance: Amber (score 55), L3 Maturity
- ⚠️ Signals: 8 signals this week (2 Warning, 6 Info)
- ⚠️ High-Risk Exposure: 2 systems (both High risk)
- ⚠️ Risk Treatment: 65% treated
Interpretation: Moderate governance maturity, elevated provider activity, some untreated risks.
Action Required (Priority Order):
- Review 2 Warning signals (click Recent Signals widget)
- Investigate 2 high-risk systems (click High-Risk Exposure widget)
- Address 35% untreated risks (click Risk Treatment card)
- Improve governance score (click Governance widget for recommendations)
Timeline: Complete within 24-48 hours.
Scenario 3: Red Alert, Immediate Attention
Dashboard State:
- 🔴 Governance: Red (score 28), L2 Maturity
- 🔴 Signals: 15 signals this week (5 Critical, 7 Warning, 3 Info)
- 🔴 High-Risk Exposure: 5 systems (3 Critical, 2 High)
- 🔴 Risk Treatment: 30% treated
Interpretation: Early-stage governance, high provider activity, significant untreated risk exposure.
Action Required (Immediate):
- Critical Signals (5): Review immediately—check for outages/breaking changes
- Click Recent Signals → Filter by Critical
- Activate fallback providers if outages detected
- Critical Systems (3): Assess impact and activate scenario response
- Click High-Risk Exposure → Review each system
- Check if workflows are customer-facing
- Untreated Risks (70%): Triage and assign treatment
- Click Risk Treatment → Review risk register
- Assign treatment for top 5 highest-severity risks
- Governance Score: Schedule governance improvement sprint
- Click Governance → Review scorecard recommendations
- Focus on high-impact controls (fallback configuration, monitoring)
Timeline: Complete within 4 hours.
Dashboard Best Practices
Daily Review Routine (5 minutes)
Morning Dashboard Check:
- Check Signals Widget — Any critical/warning signals overnight?
- Check High-Risk Exposure — Any new systems at risk?
- Scan Recent Signals — Anything affecting mission-critical workflows?
If all green: No action required. Continue with day. If amber/red: Follow scenario guidance above.
Weekly Dashboard Audit (15 minutes)
Every Monday morning:
- Governance Score Trend — Did score improve/decline from last week?
- Signal Volume Trend — Is signal volume increasing?
- Risk Treatment Progress — Did treatment % improve?
Document Findings: Add notes to internal wiki or Slack channel.
Monthly Dashboard Export (30 minutes)
Last Friday of each month:
- Screenshot Dashboard — Capture full dashboard state
- Generate Evidence Pack — Go to Governance → Evidence Pack → Generate
- Archive for Audit Trail — Save to compliance folder (ISO/NIST/EU audit prep)
Troubleshooting
Issue: Governance Widget Shows "Unable to Calculate"
Cause: No workflows configured.
Fix:
- Go to Workflows → New Workflow
- Create at least 1 workflow with provider binding
- Return to dashboard (governance score will calculate)
Issue: Signals Widget Shows "0 signals this week"
Possible Causes:
Providers not monitored yet (first poll takes 5 minutes)
- Wait: 5 minutes after adding first provider
- Check: Providers page → Ensure providers marked "In Use"
No provider changes this week (normal during quiet periods)
- Expected behavior — Some weeks have no signals
- Check: Click "View All Signals" to see historical signals
Signal retention limit (Trial licence: 7 days)
- Upgrade: Contact your account manager for increased capacity
- Contact: Support if missing recent signals
Issue: High-Risk Exposure Widget Empty
Cause: No AI systems with risk classifications.
Fix:
- Go to AI Systems → Create/import AI systems
- Classify systems by risk tier (EU AI Act)
- Return to dashboard (exposure will calculate)
Alternative Cause: All systems are low-risk (good news!).
Issue: Dashboard Loads Slowly (>5 seconds)
Possible Causes:
Large workflow count (>100 workflows)
- Expected: Queries take longer with more data
- Workaround: Use direct page links (/workflows, /signals) instead of dashboard
Network latency
- Check: Internet connection speed
- Workaround: Refresh page (widgets load independently)
Database query timeout (rare)
- Contact: Support if persistent
Mobile Dashboard
Mobile Responsiveness
Layout: Dashboard automatically adapts for mobile screens:
- Desktop: 4-column grid (Models | Workflows | Signals | Governance)
- Tablet: 2-column grid (Models/Workflows top, Signals/Governance bottom)
- Mobile: 1-column stack (all widgets vertical)
Optimizations:
- Touch-friendly buttons (min 44px tap targets)
- Collapsible widgets (expand/collapse on mobile)
- Swipe gestures for signal cards
Limitations:
- Some widgets show abbreviated data on mobile (e.g., top 3 instead of top 5)
- Charts may be simplified for small screens
Dashboard Keyboard Shortcuts
Navigation Shortcuts (v1.0)
Currently not implemented. Planned for Q2 2026.
Planned Shortcuts:
GthenD— Go to DashboardGthenW— Go to WorkflowsGthenS— Go to SignalsGthenG— Go to GovernanceR— Refresh dashboard?— Show keyboard shortcut help
Related Documentation
- Workflows — Creating and managing AI workflows
- Provider Signals — Understanding signal intelligence
- Governance Scorecard — Decision readiness framework
- Risk Scoring — How risk scores are calculated
- Quick Start Guide — First-time setup
Frequently Asked Questions
How often should I check my dashboard?
Recommended: Daily (5-minute morning check)
Minimum: Weekly (15-minute Monday review)
Critical situations: After receiving critical signal email alert (immediate check)
Why is my governance score lower than expected?
Common reasons:
- Low fallback coverage (<50% of mission-critical workflows have fallback)
- High provider concentration (>60% workflows use single provider)
- Untreated risks (>50% of identified risks have no treatment)
- Recent critical signals (5+ critical signals in last 30 days)
Fix: Click Governance widget → Review scorecard recommendations → Address highest-impact controls.
Can I customize my dashboard layout?
Currently: No (fixed layout optimized for decision readiness)
Future: Yes (planned for Q2 2026—drag-and-drop, hide/show widgets)
What does "L3 - Defined" maturity mean?
L3 - Defined means you have documented governance processes in place:
- ✅ Workflows mapped to providers
- ✅ Some risk treatments assigned
- ✅ Basic monitoring established
- ⚠️ Not yet proactive (L4) or optimized (L5)
To reach L4: Improve fallback coverage, reduce provider concentration, treat all high-severity risks.
Why don't I see any High-Risk Exposure?
Possible reasons:
- All systems are low-risk (good news!)
- No AI systems configured (go to AI Systems → Create systems)
- No signals affecting your providers (quiet week)
Check: Click High-Risk Exposure widget → If empty, system will explain why.
Last Updated: 2026-01-26 Applies To: SignalBreak Portal v2.x Documentation Version: 1.0