Appearance
Risk Scoring
SignalBreak provides continuous, automated risk scoring for your AI portfolio.
What We Measure
Provider Concentration
How dependent are you on individual AI providers? Single-provider concentration increases operational risk.
Signal Impact
When providers announce changes, how many of your workflows are affected? Higher impact = higher risk.
Governance Maturity
How well do your controls align with ISO 42001, NIST AI RMF, and EU AI Act requirements?
Operational Criticality
Risk scores are weighted by workflow criticality — mission-critical systems count more.
Risk Levels
| Score | Level | Meaning |
|---|---|---|
| 0-25 | 🟢 Low | Well-diversified, strong governance posture |
| 26-50 | 🟡 Moderate | Some concentration or control gaps |
| 51-75 | 🟠 Elevated | Significant exposure requiring attention |
| 76-100 | 🔴 High | Critical risk, immediate action recommended |
Governance Foundation
Before risk scoring begins, SignalBreak requires four foundational elements:
| Foundation | Purpose | Configuration |
|---|---|---|
| Business Sector | Sets industry-specific risk tolerances | Governance → Risk Appetite → Select sector |
| Risk Appetite (RAG) | Defines Red/Amber/Green thresholds | Governance → Risk Appetite → Configure thresholds |
| MIT Framework | Provides structured risk taxonomy | Auto-loaded (7 domains, 24 subdomains) |
| RACI Roles | Assigns accountability for governance activities | Governance → RACI Model → Assign roles |
Start Here
Configure these foundation elements before creating workflows. Risk scoring requires sector-specific thresholds and RACI assignments to produce meaningful results.
MIT AI Risk Framework
SignalBreak integrates the MIT AI Risk Repository (CC BY 4.0) — an academic taxonomy of AI risks developed at MIT for structured risk classification.
Framework Structure
The MIT framework organizes risks into 7 domains with 24 subdomains:
| Domain | Subdomains | Example Risk |
|---|---|---|
| 1. Discrimination & Bias | Fairness, Representation, Stereotyping | Model discriminates against protected groups |
| 2. Privacy & Security | Data Protection, Unauthorized Access | Training data leaks sensitive information |
| 3. Misinformation | False Content, Manipulation | Model generates misleading information |
| 4. Malicious Use | Dual-Use, Weaponization | Technology repurposed for harmful applications |
| 5. Human-Computer Interaction | Over-Reliance, Deskilling | Users trust AI without verification |
| 6. Socioeconomic & Environmental | Job Displacement, Energy Use | Automation eliminates jobs, carbon footprint |
| 7. AI System Safety | Robustness, Interpretability | Model fails unexpectedly, decisions opaque |
Each workflow risk in SignalBreak is classified using a MIT subdomain code (e.g., 1.1, 3.2, 7.4).
Risk Code Format
Risks are identified with codes in the format: subdomain_code/workflow_initials
Example: 2.1/CHRA
2.1= MIT subdomain "Data Protection & Privacy"CHRA= Workflow initials "Customer HR Assistant"
This format enables:
- Quick identification of risk type
- Grouping risks by MIT domain for reporting
- Cross-workflow risk analysis
Mitigation Library
SignalBreak includes 831 pre-mapped mitigations extracted from 13 governance frameworks:
| Framework | Mitigations | Focus |
|---|---|---|
| NIST AI RMF | 120+ | Risk management process |
| EU AI Act | 95+ | Legal compliance (EU) |
| ISO 42001 | 85+ | Management system standard |
| OECD AI Principles | 50+ | Ethics and trust |
| Singapore Model AI Framework | 40+ | Practical implementation |
| + 8 more frameworks | 441+ | Sector-specific guidance |
Each mitigation is:
- Categorized into 4 categories and 23 subcategories
- Mapped to relevant MIT subdomains with relevance scores (1.0 = primary, 0.8 = secondary, 0.5 = tertiary)
- Documented with implementation examples
- Attributed with source framework and citation URL
How it works:
- Identify a risk and classify it using MIT subdomain (e.g.,
3.2= "Misinformation") - SignalBreak suggests relevant mitigations ranked by relevance score
- Select mitigations to apply as controls in your workflow
- Document treatment status (Mitigated, Accepted, Transferred, Avoided)
To access:
- Navigate to Workflows → Select a workflow → Risk Tab
- Click on a risk → View suggested mitigations
- Or navigate to Governance → Mitigations to browse the full library
Framework Attribution
The MIT AI Risk Repository is used under CC BY 4.0 license: Slattery, P., Saeri, A. K., Besiroglu, T., Burden, J., Juneja, J., et al. (2024). The AI Risk Repository. Available at: https://airisk.mit.edu
Business Sector Selection
SignalBreak customizes risk tolerances based on your industry sector. Different sectors have different regulatory requirements and risk appetites.
Why Sector Matters
| Sector | Risk Tolerance | Reason |
|---|---|---|
| Financial Services | Low | Strict regulation (GDPR, Basel III, MiFID II) |
| Healthcare | Low | Patient safety, HIPAA, medical device regulations |
| Government/Public | Low | Public accountability, transparency requirements |
| Education | Medium | Moderate oversight, student data protection |
| Technology | Medium | Fast-paced innovation, lighter regulation |
| Retail/E-commerce | Medium | Consumer protection, payment security |
| Manufacturing | Medium | Safety standards, operational continuity |
| Professional Services | Medium | Client confidentiality, professional standards |
| Media & Entertainment | High | Creative freedom, rapid iteration |
| Telecommunications | Medium | Infrastructure criticality, regulatory oversight |
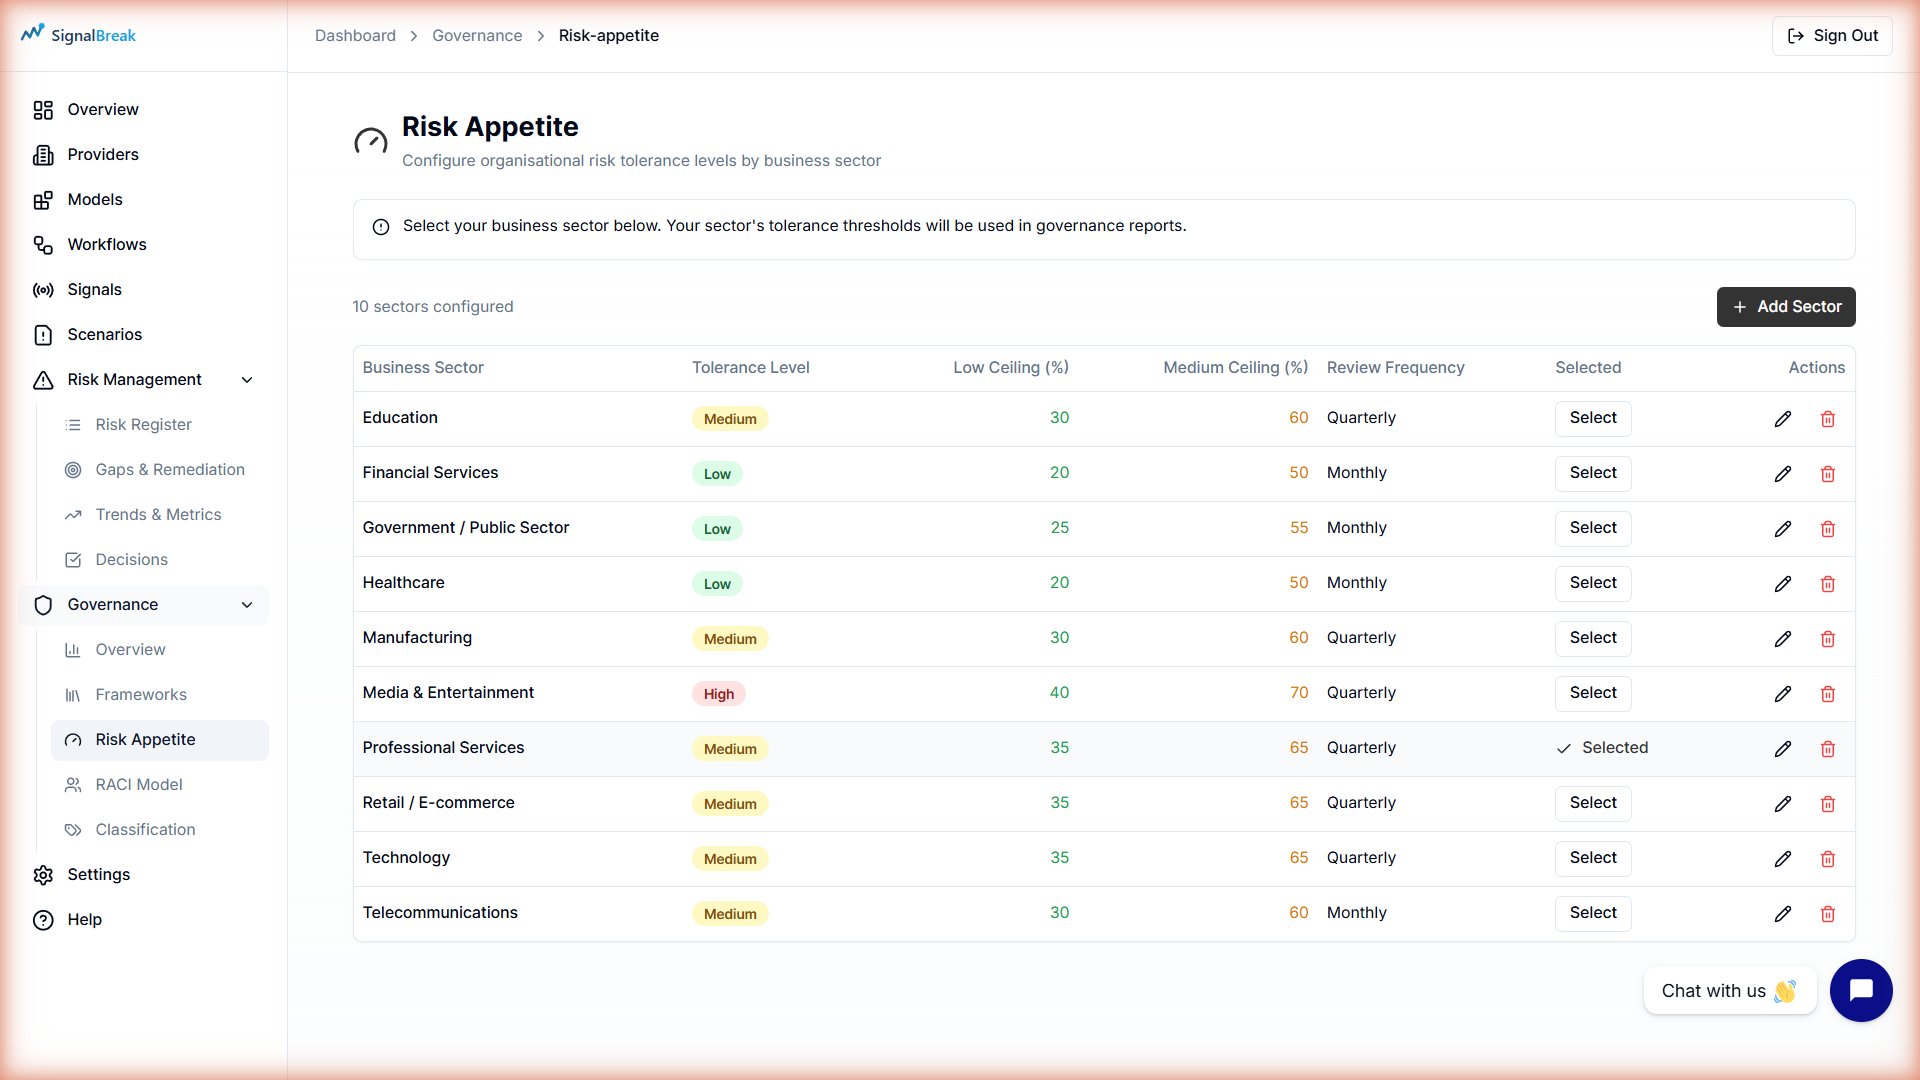
Available Sectors
SignalBreak includes 10 common sectors with pre-configured risk appetite thresholds:
| Sector | Tolerance Level | Low Threshold (Green) | Medium Threshold (Amber) | Review Frequency |
|---|---|---|---|---|
| Financial Services | Low | 20% | 50% | Monthly |
| Healthcare | Low | 20% | 50% | Monthly |
| Government/Public | Low | 25% | 55% | Monthly |
| Education | Medium | 30% | 60% | Quarterly |
| Retail/E-commerce | Medium | 35% | 65% | Quarterly |
| Technology | Medium | 35% | 65% | Quarterly |
| Manufacturing | Medium | 30% | 60% | Quarterly |
| Professional Services | Medium | 35% | 65% | Quarterly |
| Media & Entertainment | High | 40% | 70% | Quarterly |
| Telecommunications | Medium | 30% | 60% | Monthly |
How to Select Your Sector
- Navigate to Governance → Risk Appetite
- Click Seed Common Sectors to load all 10 pre-configured sectors
- Click Select as Default next to your industry sector
- Your selected sector determines:
- RAG threshold defaults for risk scoring
- Governance report baselines
- Recommended review frequencies
- Industry benchmarking comparisons
Custom Sectors
You can also create custom sectors if your industry isn't listed. Click Add Sector and configure thresholds manually.
Risk Appetite Configuration (RAG Thresholds)
Risk appetite defines your organization's tolerance for AI-related risks using RAG (Red/Amber/Green) thresholds.
RAG Color System
┌──────────────────────────────────────────────────────────┐
│  RISK SCORE CALCULATION                                  │
├──────────────────────────────────────────────────────────┤
│  0% ────────────────────────────────────────────── 100%  │
│  🟢 GREEN           🟡 AMBER             🔴 RED           │
│  (Acceptable)       (Monitor)        (Action Required)   │
└──────────────────────────────────────────────────────────┘

Thresholds:
• ≤ threshold_low        → 🟢 GREEN (risk acceptable)
• threshold_low < x ≤ threshold_medium → 🟡 AMBER (requires monitoring)
• > threshold_medium     → 🔴 RED (immediate action required)
Threshold Configuration
Each sector has customizable thresholds:
| Threshold | Meaning | Example (Financial Services) |
|---|---|---|
| Low (Green boundary) | Upper limit of acceptable risk | 20% |
| Medium (Amber boundary) | Upper limit of tolerable risk | 50% |
| High (Red zone) | Unacceptable risk requiring action | >50% |
Example:
- Risk score of 15% → 🟢 Green (well below 20% threshold)
- Risk score of 35% → 🟡 Amber (between 20-50%, monitor closely)
- Risk score of 65% → 🔴 Red (exceeds 50%, immediate remediation required)
Configuring Risk Appetite
To configure thresholds:
- Navigate to Governance → Risk Appetite
- Click Edit (pencil icon) next to a sector
- Adjust the threshold percentages:
- Threshold Low: Maximum % for GREEN status
- Threshold Medium: Maximum % for AMBER status
- Anything above medium = RED
- Set Review Frequency: How often to reassess (Weekly/Monthly/Quarterly/Annually)
- Click Save
Changes apply immediately to:
- Dashboard risk score colors
- Governance framework compliance reports
- Risk Register status indicators
- Evidence pack RAG assessments
Sector-Specific Thresholds
Some industries (Financial Services, Healthcare, Government) require stricter thresholds due to regulatory obligations. Don't set thresholds too high for regulated industries.
Tolerance Levels
Each sector also has a tolerance level indicating overall risk appetite:
| Level | Description | Sectors |
|---|---|---|
| Low | Conservative, risk-averse | Financial Services, Healthcare, Government |
| Medium | Balanced risk/innovation | Technology, Education, Retail, Manufacturing |
| High | Innovation-focused, accepts more risk | Media & Entertainment, Startups |
This level is informational and guides threshold recommendations, but the actual threshold percentages determine RAG colors.
RACI Model Integration
SignalBreak uses RACI (Responsible, Accountable, Consulted, Informed) to assign clear accountability for governance activities and workflow ownership.
What is RACI?
| Role | Meaning | Example |
|---|---|---|
| R (Responsible) | Does the work | AI Engineer implements mitigation |
| A (Accountable) | Owns the outcome (only one per activity) | VP Engineering approves deployment |
| C (Consulted) | Provides input | Security team reviews architecture |
| I (Informed) | Kept in the loop | Executives receive status updates |
Two-Layer RACI System
SignalBreak implements RACI at two levels:
1. Workflow-Level RACI (per AI system)
Each workflow has 5 optional RACI roles:
| Role | Required? | Typical Assignment | Responsibility |
|---|---|---|---|
| Workflow Owner | ✅ Yes | AI Engineer, Product Manager | Day-to-day management (R) |
| Exec Sponsor | Optional | VP, Director | Decision authority (A) |
| Platform Lead | Optional | Infrastructure Lead | Technical operations (C) |
| AI/ML Lead | Optional | ML Engineer, Data Scientist | Model governance (C) |
| GRC Lead | Optional | Compliance Officer | Risk & governance (C) |
How to assign workflow RACI:
- Navigate to Workflows → Select a workflow
- Go to Ownership Tab
- Fill in role details (name, email, role title)
- Click Save RACI Assignments
Required Field
Workflow Owner is mandatory. You cannot save a workflow without assigning an owner. Other roles are optional.
2. Governance Matrix RACI (organization-level)
Define organizational governance responsibilities using a matrix:
Rows = Governance Activities (e.g., "Risk Assessment Review," "Evidence Pack Preparation") Columns = Organizational Roles (e.g., "Data Scientist," "Security Officer," "Compliance Lead") Cells = Responsibility assignment (R, A, C, I)
How to configure governance RACI:
- Navigate to Governance → RACI Model
- View the matrix grid (Activities × Roles)
- Click a cell to cycle through: R → A → C → I → Empty
- Changes save automatically
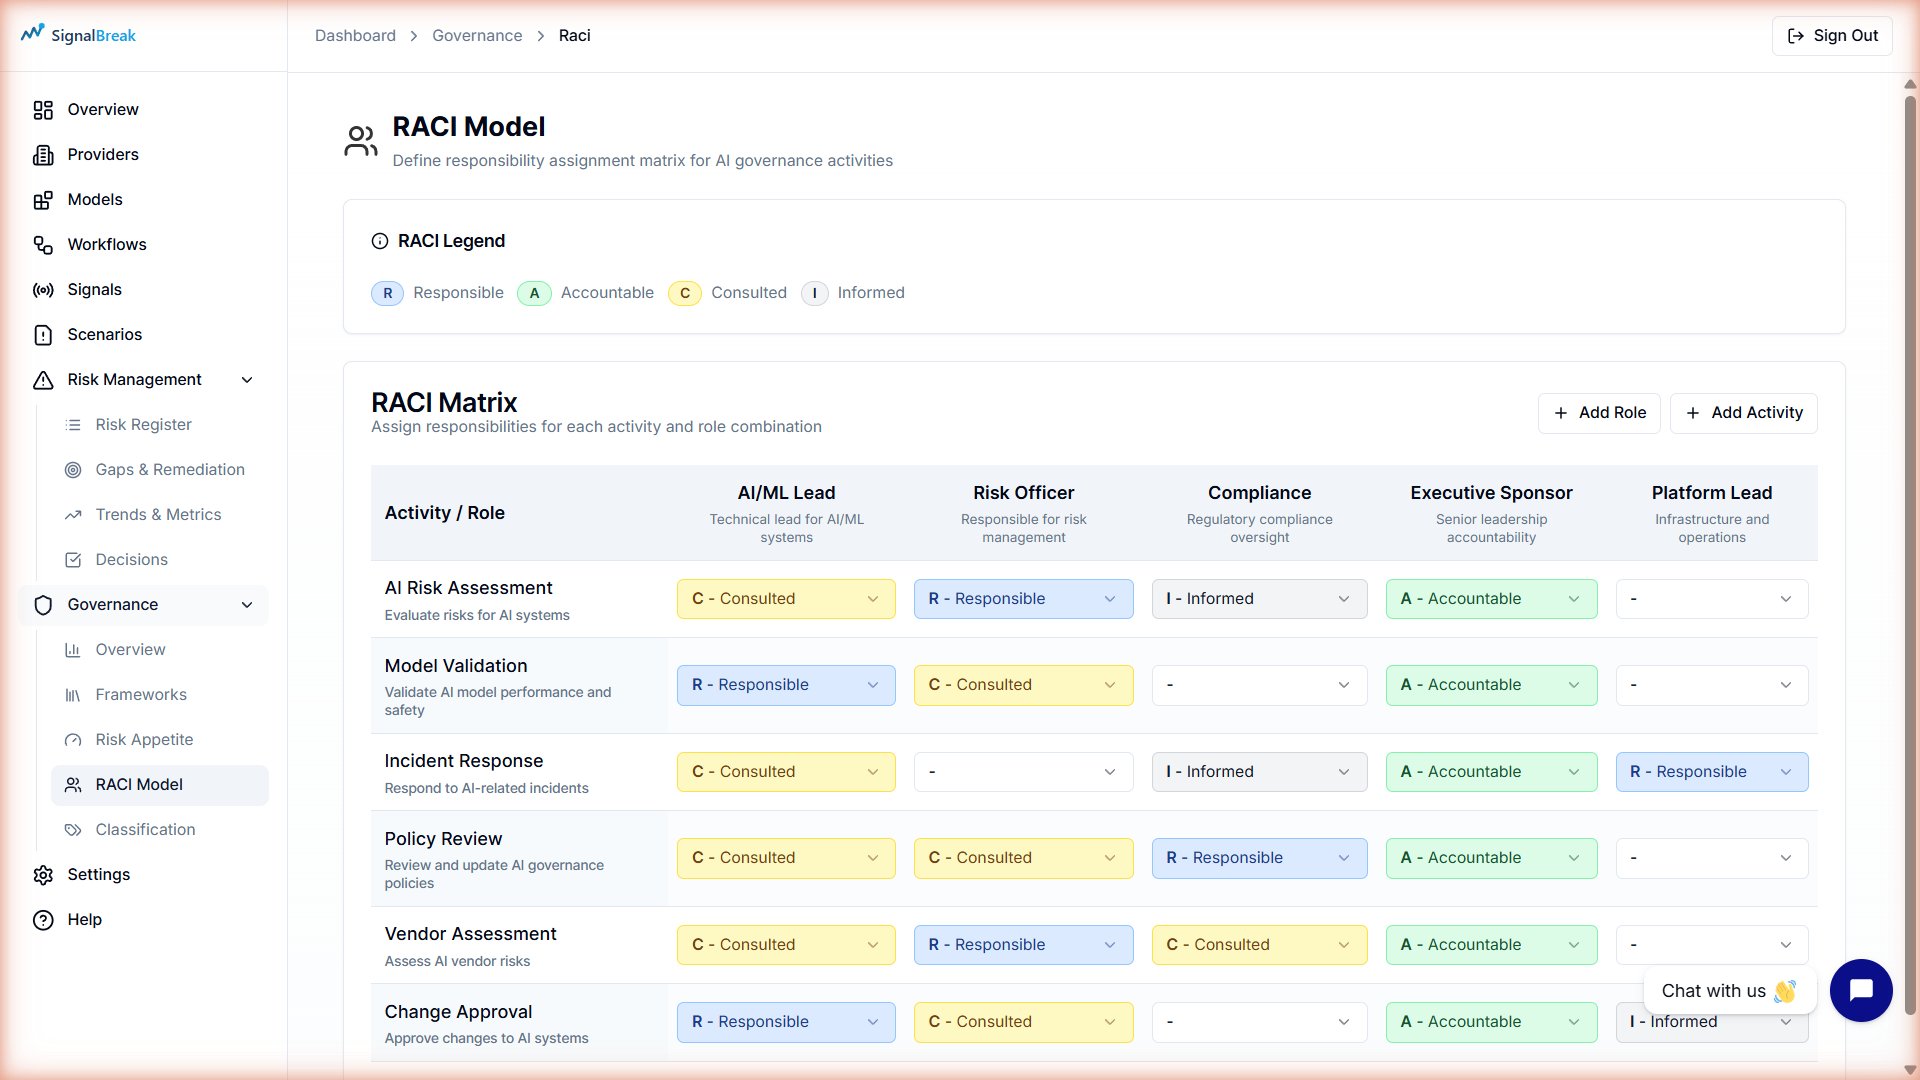
Example matrix:
| Activity | Data Scientist | Security Officer | Compliance Lead | Exec Sponsor |
|---|---|---|---|---|
| Risk Assessment Review | R | C | A | I |
| Evidence Pack Preparation | C | C | R | A |
| Framework Mapping | C | I | R | A |
| Control Implementation | R | C | C | I |
RACI Coverage Metrics
SignalBreak tracks RACI completeness across your organization:
| Metric | Formula | Good Target |
|---|---|---|
| Ownership % | (Workflows with owner ÷ Total workflows) × 100 | ≥90% |
| Exec Sponsor Coverage | (Workflows with exec sponsor ÷ Total workflows) × 100 | ≥60% for Critical workflows |
| GRC Coverage | (Workflows with GRC lead ÷ Total workflows) × 100 | ≥80% for High/Critical workflows |
View these metrics in Governance → Overview dashboard.
RACI & Risk Decisions
RACI roles are used when making risk treatment decisions:
| Treatment | Typical Authority | RACI Role |
|---|---|---|
| Mitigate (implement control) | Workflow Owner | R (Responsible) |
| Accept risk £5k-£25k | Committee | Exec Sponsor (A) |
| Accept risk £25k-£100k | Executive Leadership | Exec Sponsor (A) |
| Accept risk >£100k | Board | Exec Sponsor (A) must escalate |
| Transfer (insurance/vendor) | Procurement + GRC | GRC Lead (R) |
| Avoid (stop using feature) | Product Owner | Workflow Owner (R) + Exec Sponsor (A) |
See Risk Management documentation for full authority matrix details.
Scoring Methodology
SignalBreak's risk scoring combines all governance foundation elements:
┌─────────────────────────────────────────────────────────┐
│  RISK SCORE CALCULATION                                 │
├─────────────────────────────────────────────────────────┤
│                                                          │
│  1. MIT FRAMEWORK                                        │
│     • Classify risks using MIT subdomains (1.1-7.4)     │
│     • Suggest mitigations from 831-control library      │
│                                                          │
│  2. BUSINESS SECTOR                                      │
│     • Apply sector-specific risk tolerances             │
│     • Compare against industry benchmarks               │
│                                                          │
│  3. RAG THRESHOLDS                                       │
│     • Calculate risk score (0-100%)                     │
│     • Map to Green/Amber/Red using sector thresholds    │
│                                                          │
│  4. RACI ACCOUNTABILITY                                  │
│     • Assign ownership to workflows & activities        │
│     • Track treatment responsibility                    │
│     • Measure governance coverage                       │
│                                                          │
│  5. CONTEXTUAL FACTORS                                   │
│     • Provider intelligence (health, incidents)         │
│     • Workflow criticality (Low/Medium/High/Critical)   │
│     • Signal impact (how many workflows affected)       │
│     • Provider concentration (diversification)          │
│                                                          │
└─────────────────────────────────────────────────────────┘

FINAL SCORE = Weighted combination of all factors
              adjusted by sector-specific RAG thresholds
              displayed as Green/Amber/Red indicator
Weighting Factors
| Factor | Weight | Rationale |
|---|---|---|
| Governance Maturity | 35% | Controls reduce risk |
| Provider Concentration | 25% | Diversification reduces operational risk |
| Signal Impact | 20% | Incident frequency matters |
| Operational Criticality | 20% | Mission-critical systems weighted higher |
Detailed Formulas
Complete scoring formulas, weighting factors, and calculation examples are available in the platform under Governance → Methodology.
Continuous Monitoring
Unlike point-in-time audits, SignalBreak scores update continuously as:
- New signals are detected
- Provider health changes
- Workflows are added or modified
- Governance controls are implemented